
Multi-Tier Bonus & Profit-Sharing Platform
Consolidates franchise stores, revenue, profit sharing, and qualification data into a single dashboard for HQ to monitor monthly operations and bonus distributions. Case study screens reflect the original UI with brand elements de-identified.
01|HQ Portal|Multi-Tier Bonus Operational Dashboard
HQ can view franchise stores, monthly revenue, profit-sharing amounts, bonus categories, partner counts, and qualification distributions by month.
Key Metrics
Latest performance after stable system operation; hover or focus on bars to view values and insights.
Current Status:Tiered Configuration
Manage by position, role, service, and sales performance tier
Manage by position, role, service, and sales performance tier
Current Status:Traceable Transactions
Commission items can be traced back to source transactions
Commission items can be traced back to source transactions
Current Status:Three-Way Integration
Seamless data connection across stores, HQ, and members
Seamless data connection across stores, HQ, and members
Challenges Faced
Franchise operations and multi-tier bonus data were scattered, making it difficult for headquarters to quickly grasp overall profit-sharing status.
- ✕Profit-sharing terms across franchise stores, partners, and qualification tiers are hard to manage centrally.
- ✕Revenue, profit sharing, and various bonuses are scattered, making quick cross-examination difficult for managers.
- ✕Lacks a holistic view of monthly trends and qualification distribution, making operational analysis time-consuming.
Our Approach
Centralizes stores, revenue, profit sharing, and qualification distribution on an operational dashboard to establish a unified management view.
- ✓Operational Metrics Integration Aggregates franchise stores, monthly revenue, profit sharing, and partner count.
- ✓Multi-Tier Bonus Management Centralizes profit-sharing calculations, supply rebates, and technical team bonuses.
- ✓Trend Analysis Compares monthly changes in revenue and profit sharing.
- ✓Qualification Distribution Visualizes proportion of titles such as Directors, Managers, Department Heads, and Franchisees via charts.
- ✓Management Module Integration Covers contracts, referrers, branches, reports, accounts, and system logs.
Key Results
- Consistent Rules Stores and HQ calculate based on the exact same commission terms.
- Unified View Centralizes operational and profit-sharing metrics into a single management interface.
- Clear Trends Enables direct comparison of monthly changes and qualification structures.
From Franchise Operations to Multi-Tier Bonus Management
Connects profit-sharing rules, qualification management, and HQ reporting based on franchise and operational data.
Franchise Operations
Store, Partner, and Revenue Data
Franchise Stores
Branch and Contract Master Data
Revenue Data
Monthly Store Revenue
Rules & Profit Sharing
Multi-Tiered Commission Core
Commission Rule Engine
Qualification Tiers & Profit-Sharing Terms
Profit Sharing Calculation
Management, Supply & Technical Bonuses
HQ Management
Query, Analysis & Audit
Qualification Management
Qualification Tiers & Distribution Statistics
HQ Reports
Revenue, Profit Sharing & Trend Analysis
- Franchise & Sales Data Aggregation → Monthly Operational Metrics
- Eligibility & Profit-Sharing Criteria → Bonus Rule Engine → Profit-Sharing Calculation
- Revenue & Profit-Sharing Results → Trend Charts & HQ Reports
Tech Stack Guide
Operations Dashboard
Aggregates franchise stores, partners, and monthly revenue
Multi-Tiered Commission Engine
Manages bonus rules based on qualifications and profit-sharing terms
Profit Sharing Management
Centralizes management bonuses, supply rebates, and technical team bonuses
Qualification Management
Manages qualification tiers and displays distribution percentages
Cross-Store Reports
Compares revenue and profit sharing by month and operational item
Related Projects
Related Case Studies
Recommended by service type and industry sector to help you compare approaches and results across different scenarios.
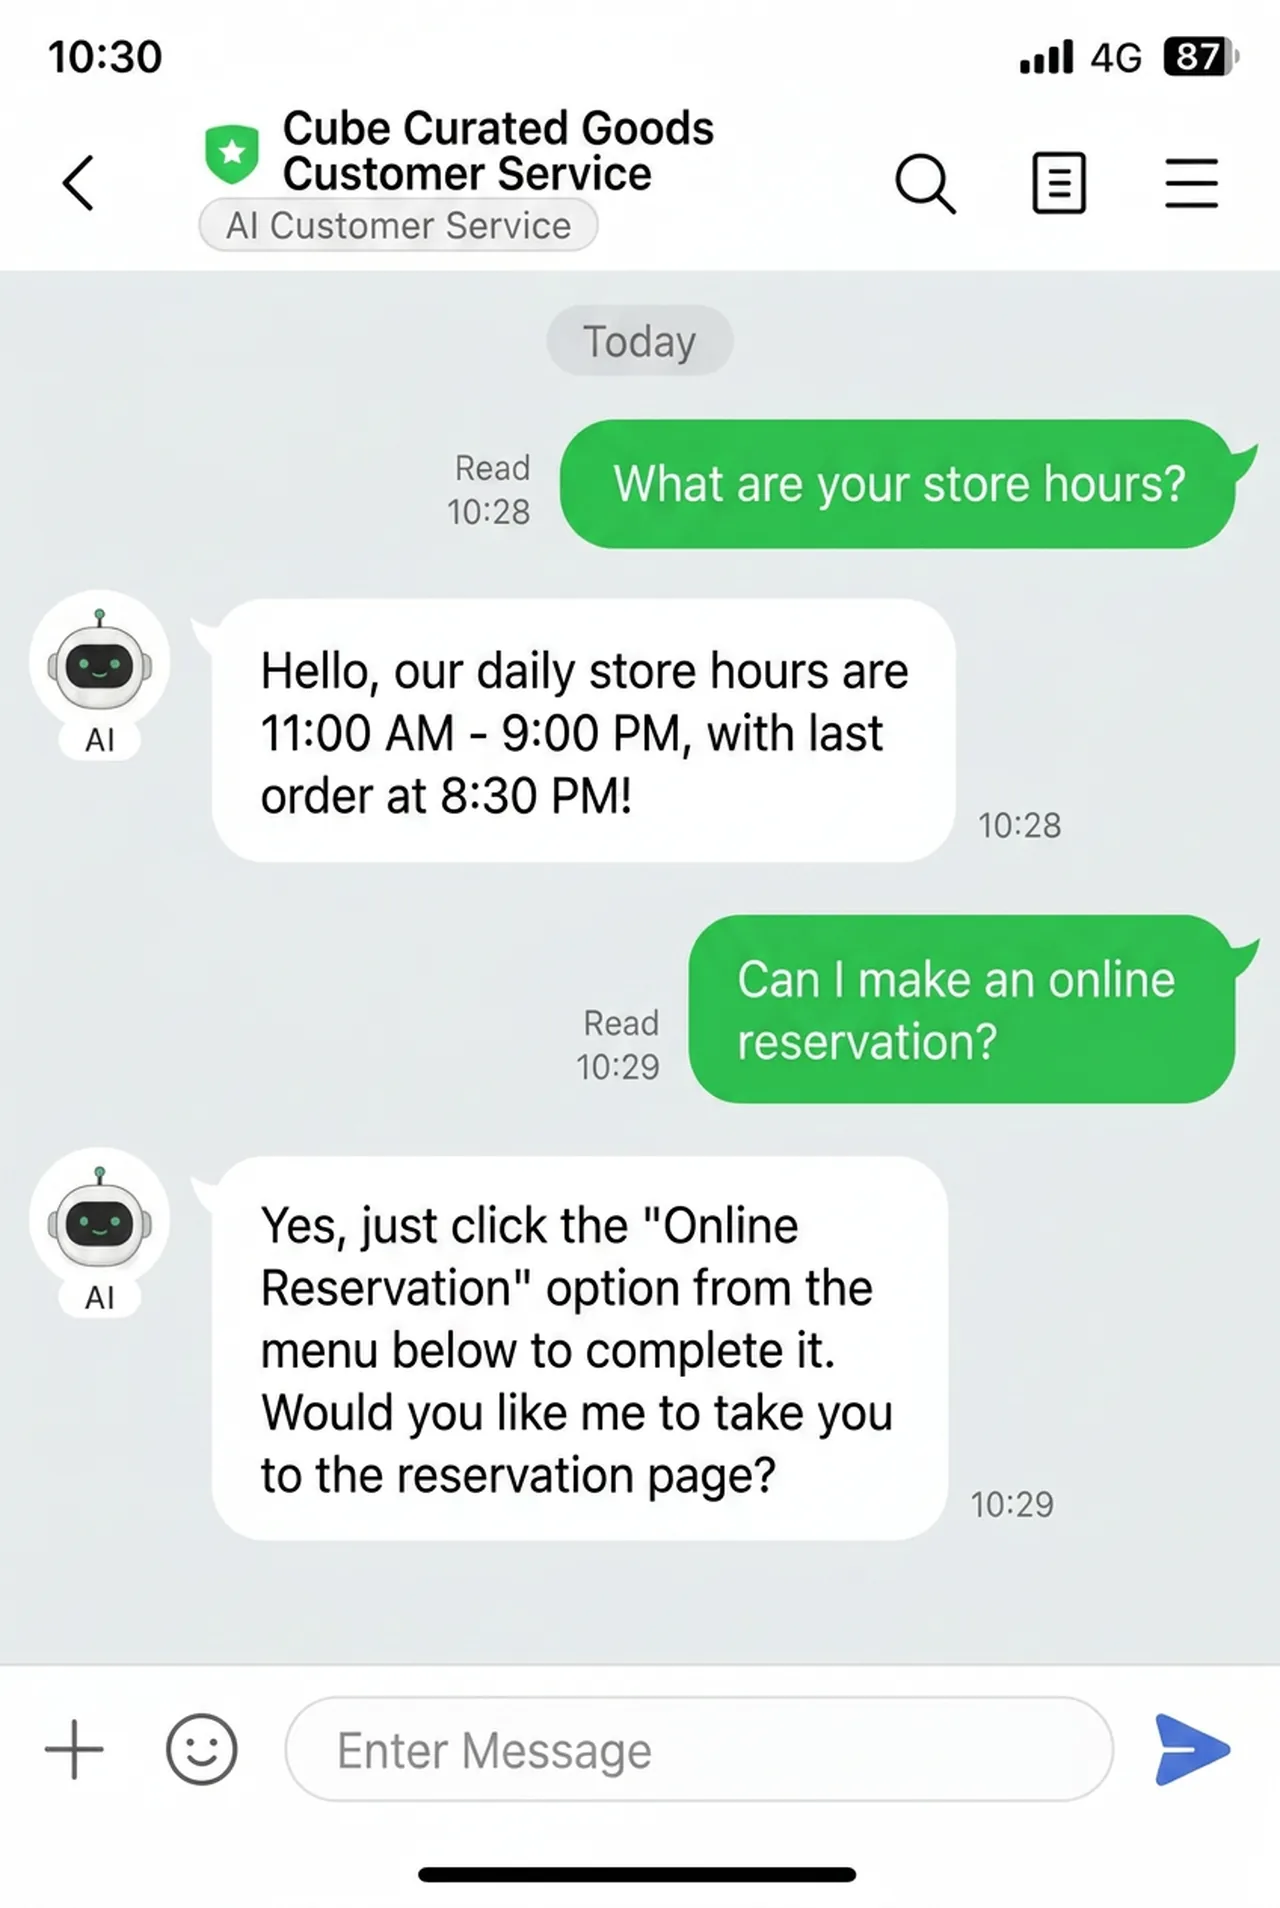
Self-built LINE AI Customer Service Bot Platform
Integrate OpenAI bot settings and LINE Official Account agent workbench into a single backend: Knowledge bases, reply rules, human handovers, and performance tracking are all on one screen—no more writing lengthy system prompts.
View Case Study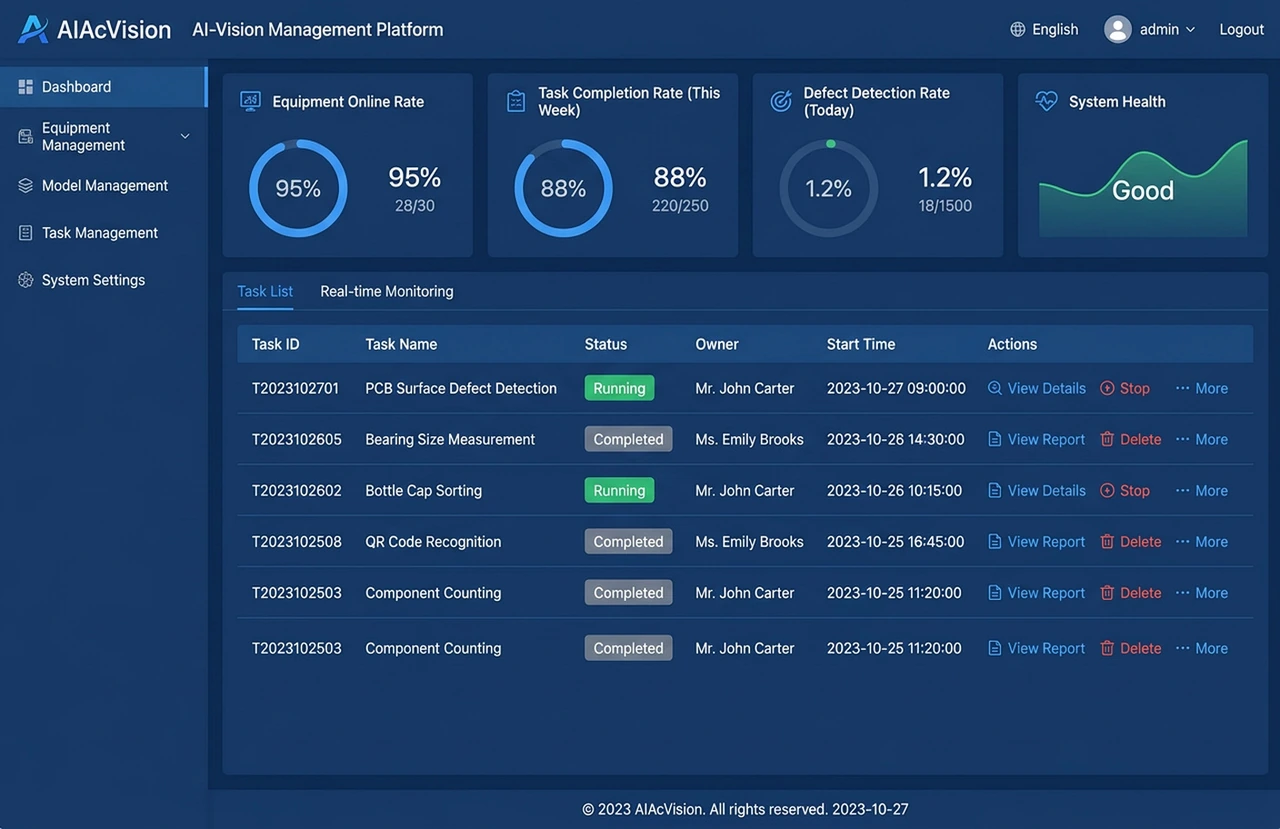
Defect Inspection Deployment for Manufacturing Lines
Build custom defect datasets from field images, train tailored models deployed to edge devices, and stream recognition results back to the cloud for ongoing tracking and retraining.
View Case Study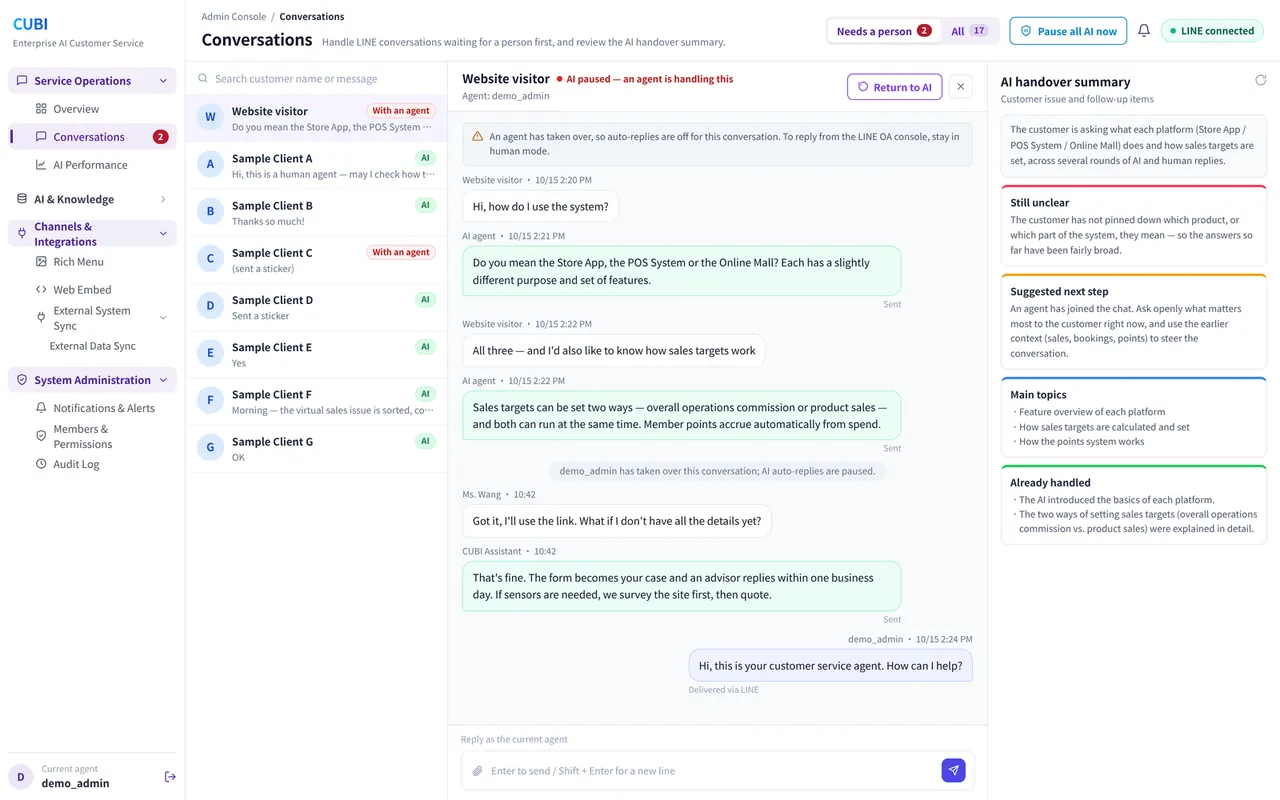
CUBI operational Q&A implementation for retail and distribution
Connect to existing inventory databases, enabling executives to query inventory and sales trends using natural language, replacing manual report generation workflows.
View Case StudyHave needs for system development, AI integration, or product solutions?
With 20 years of system development experience and successful deployments across major industries, we offer one-stop services from requirement clarification to live operation and maintenance.